PerfView is a Performance Analysis & Profiling Tool
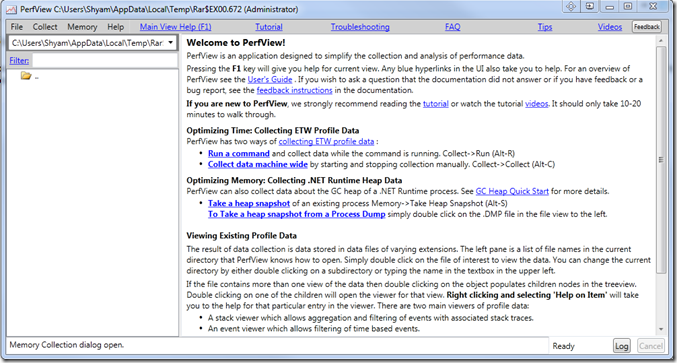
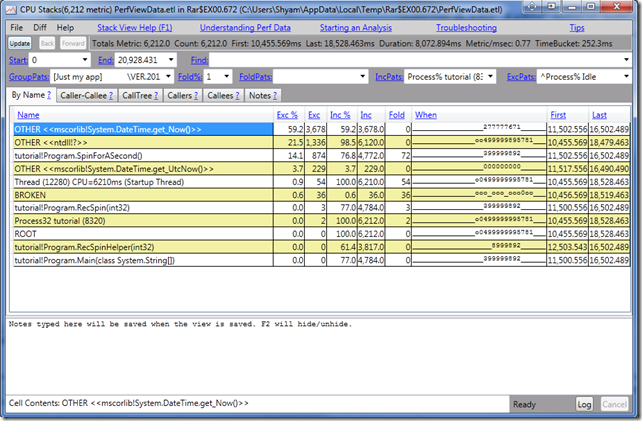
Unlike some other tools, I have found PerfView from Microsoft, to be very user-friendly with tons of hyperlinked information for the user, to understand how it works. Microsoft has included a Tutorial.exe file; try it and see how it works. The tool uses the Event Tracing for Windows (ETW) feature to analyze and dump the data. It’s very helpful while troubleshooting performance-related problems for your program. The tool basically takes snapshots of the stacks, by interrupting the CPU. It is highly recommended to read the Tutorial section and the guides provided within the tool, to understand the tool better. Random read: Customize Ctrl+Alt+Del Screen using Group Policy or Registry. By default, it takes the stack of all the processes – but you can choose the EXE file that you want to troubleshoot. As you can see in the image below, it tells you the name of each frame in the stack collection, with the total cost of the CPU and the total amount of the cost.
This way, the troubleshooting is a lot easier, and it helps you find out, which frame in the stack could be causing the CPU usage problems and pinpoint the source of it. You can also define the Symbol server so that it downloads it and caches it locally. It is a great tool for application developers to narrow down and pinpoint performance-related problems, more effectively. If you’re an application developer, be sure to check out PerVeiw; it will certainly help you. You can download it from github.com.